Step 2: Set Your Long-Term Investment Objectives
Taking into account the long-term nature of successful investing, we set objectives for your portfolio that are appropriate for your willingness, ability and need to take risk; and the investment horizon(s) you identify.
Investors know they should be long-term investors. This often gives rise to the question “How long is long term?” The answer for many investors is surprising—your long-term horizon should be as far into the future as possible. One of the many surprising facts about investing is that having a long horizon is a powerful advantage. You want your horizon to be as long as possible, because as an investor, time is your best friend.
For many investors, the most important long-term goal is to achieve financial freedom in order to be able to do what they want. But many investors also have intermediate-term goals—for example, funding children’s education, buying holiday homes and building assets for retirement. Investors may also have goals that reach far into the future—for example, they may wish to leave legacies to their children, grandchildren and even great-grandchildren.
Regardless of the time horizon of your goals, the simple fact remains that the more time you have, the more likely you are to succeed as an investor. Why? There are two reasons. The first is the miracle of compound growth, and the second is the phenomenon of risk reduction over time.
The Miracle of Compound Growth
Compound growth operates on a very simple principle. When you put money aside to earn returns, and then reinvest those returns, you have both your original investment and the returns working for you. The longer you allow this process to continue, the greater your accumulation will likely be. Imagine putting $1,000,000 into an investment that consistently earns 8% every year. The table below shows how the compounding process works.1
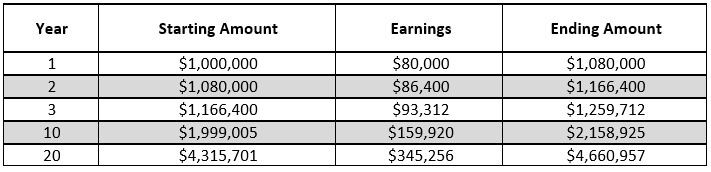
At 8% pa, your investment would grow to more than 4.5 times its original size in 20 years. To see the effect of compounding, notice that you would earn $1,158,925 in returns in the first ten years, but even more in the second ten years—$2,502,032.
While many people are familiar with the concept of compound growth, they may not be so strongly aware that time actually also helps reduce investment risk, especially in diversified portfolios of shares. It is natural to worry that if you invest in the share market today, it may go down tomorrow. But if you have a long investment horizon, tomorrow is just one of the thousands of market days during which you will be investing. Over long periods of time, many of the ups and downs in the market are cancelled out, leaving the broad market trend.
The following graph shows how the range of annualised outcomes for Australian large capitalised shares narrows as your horizon becomes longer. It shows results based on the annual performance of the S&P/ASX 100 Accumulation Index 1980 to 20142. The market has produced a wide range of outcomes. An investor holding shares for just one calendar year could have had returns ranging from a high of 67.79% to a low of -37.21%. An investor with a ten-year horizon could have experienced annualised returns ranging from a high of 18.35% to a low of 6.18%.
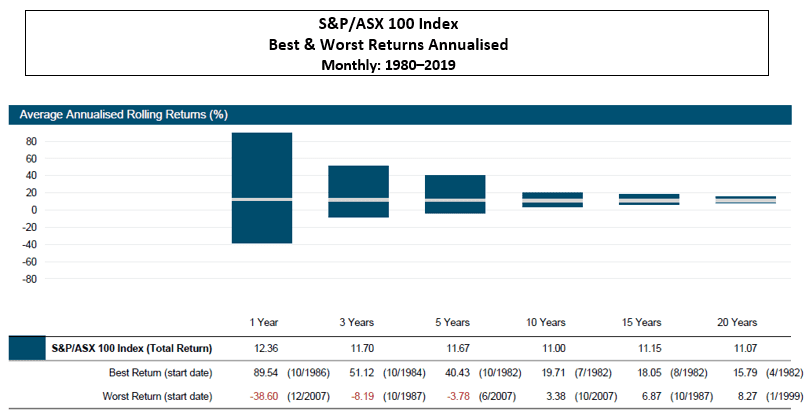
As much as time can reduce your risk, many investors looking at this chart would still feel that the share market itself is too risky. In designing your portfolio, we will make use of asset allocation beyond any one asset class, including Australian shares, in order to further significantly reduce risk.
However, it’s important for you to have a long-term perspective with any equity portfolio. The minimum expected investment period should be five years for any portfolio containing equity securities. For any portfolio with less than a five-year horizon, the portfolio should be comprised predominantly of fixed interest investments. This five-year minimum investment period is important in that the investment process must be viewed as part of a long-term plan for achieving the desired results. This is because one-year volatility can be significant for certain asset classes. However, over a five-year period, volatility is greatly reduced. A time horizon of ten years or longer will serve to increase the likelihood of achieving your financial goals even more.
Your Attitude Towards Risk
While we can do a great deal to mitigate risk, we cannot eliminate it. In any investment plan, it is important to understand both the types and the amount of risk you are taking and to be sure that you are comfortable with these. This understanding will greatly increase your ability to adhere to your long-term investment plan and increase your chances of achieving your financial goals.
The right level of risk for you depends on both your personal preferences and your situation. We break the risk equation into the following four parts:
1. Risk Tolerance: Your Response to Market Fluctuations
Over the course of your investment life, the value of your portfolio will rise and fall. While we would always rather see our portfolio value rise, a prudent investor knows that any investment will have some periods in which the value will fall. Equity markets, in particular, are very volatile and investors must expect that there will be regular periods of rising prices and regular periods of falling prices.
Your risk tolerance describes your level of comfort in waiting through the downturns. If the risk you take is within your risk tolerance, then you will be able to maintain your investment strategy through both strong markets and weak ones, giving you the best chance of investment success.
2. Risk Aversion: Your Vulnerability to Losses
Designing an appropriate investment strategy requires understanding and weighing factors that can be in conflict. Your tolerance for risk may be high, but as a prudent investor, you should consider your ability to withstand financial losses. Because market downturns are unpredictable, you need to assess the real economic harm you might face if your portfolio seriously declined in value. If your portfolio failed to provide the returns you had planned for, would you need to adjust your goals?
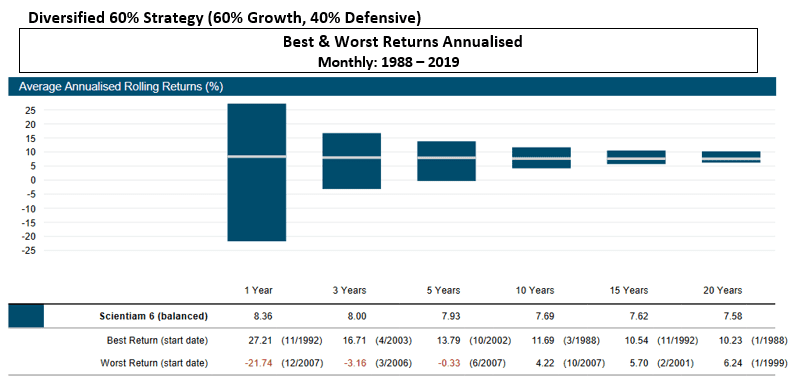
The chart below shows the best and worst returns of a model portfolio of investment strategies utilising index asset classes since 19913. The longer your time horizon is, the greater your ability to withstand risk.
3. Risk Avoidance: Your Need to Take Risk
Most investors would not choose to take more risk than is necessary. While this is a simple statement, investors often fail to build this concept into their investment planning. Your need to take risk is directly tied to your rate-of-return objective.
If you need your portfolio to grow more quickly over your time horizon, you will want a higher rate of return. An increase in your rate-of-return objective, however, will generally mean taking more risk. If your return objective is higher than your risk tolerance (willingness to take risk) or your risk aversion (your vulnerability to losses), then you must adjust one or more of these parameters. This could mean, for example, retiring later and possibly subjecting yourself to the discomfort of greater risk or increasing your savings.
On the other hand, if your rate-of-return objective can be lowered because your assets can support your goals with less growth, then your need to take risk is reduced and your portfolio should be allocated accordingly. As your portfolio grows over time, your need to take risk should be reassessed and your investment strategy adjusted accordingly.
4. Your Tolerance for Tracking Error: Your Ability to Have Your Portfolio Look Different from Popular Indices
Many investors are more comfortable when they know they are doing as well, or as poorly, as most other investors. A portfolio that tracks the returns of a popular index such as the S&P/ASX 100 Accumulation Index can provide that comfort, despite the fact that it may not provide the risk management or higher returns that may be available from an effectively diversified portfolio.
Tracking error is the amount by which the performance of a portfolio differs from that of major market indices. You should understand your personal tolerance for the tracking error that can result from a portfolio that purposely diversifies away from popular indices in order to decrease volatility and increase expected returns.
Bear in mind that tracking error can be present over lengthy periods. If, for example, your portfolio is weighted heavily toward value asset classes because of the expected higher return over time, it will often look quite different from the S&P/ASX 100 Accumulation Index, which is composed primarily of growth shares. The difference can be either positive or negative, and may be present over many years.
Rate-of-Return Objective
Every investment choice you make involves a trade-off between risk and return. In general, a portfolio of safer investments will have less growth potential than a riskier one. To increase the rate-of-return objective, you will typically have to take more risk. Thus, your rate-of-return objective must match the realistic opportunities that you have, given your time horizon and ability to take risk. If your rate-of-return objective is higher than your time horizon and risk attitude permit, then you must adjust one of the three parameters.
All other things being equal, you would most likely prefer to have a higher return. In particular, if two portfolios were equally risky, but one made a higher rate-of-return objective feasible, then you would choose the more rewarding portfolio. One way to construct a rate-of-return objective is to find the portfolio that offers the highest possible rate-of-return objective for your time horizon and risk attitude. In the language of the academic study of investments, this is an efficient portfolio.
Over a long investment horizon, a modest increase in your rate-of-return can make a significant difference in the amount you accumulate. The table below shows the sum to which an initial investment of $1,000,000 will grow over 10 and 20 years at rates of return ranging from 2% to 10% each year.4
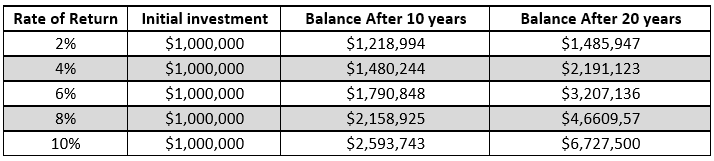
1Figures are for illustrative purposes only and are not a guarantee of future performance. Figures do not reflect the effect of fees or taxes.
2Australian large capitalised share performance calculations are based on annual performance of the S&P/ASX 100 Accumulation Index, an unmanaged index intended to represent the performance of a diversified portfolio of large cap Australian shares.
3Arch Capital Balanced Strategy is composed of 60% growth assets and 40% defensive assets. See Appendix for the portfolio construction.
4Figures are for illustrative purposes only and are not a guarantee of future performance. Figures do not reflect the effect of fees or taxes.